AP Biology Laboratory Resources
On this page you will find helpful links and resources to help you complete the 13 AP Biology investigative labs.
Mini-Poster Information
Mini-Poster Grading Rubric
Scientific Paper Guidelines
LabWrite, an online tutorial for writing a lab report
Mini-Poster Information
Mini-Poster Grading Rubric
Scientific Paper Guidelines
LabWrite, an online tutorial for writing a lab report
Lab 1: Artificial Selection
Perform artificial selection in the lab using Wisconsin Fast Plants.
Download the pdf file of the lab here.
Download the pdf file of the lab here.
Lab 2: Hardy-Weinberg (Mini-Poster Due 8/28/13)
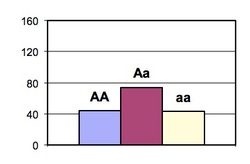
Use a spreadsheet to model Hardy-Weinberg equilibrium in a hypothetical population.
Download the pdf file of the lab here.
Use this handy Hardy-Weinberg spreadsheet if you are unsure about how to make your own using Excel.
Download the pdf file of the lab here.
Use this handy Hardy-Weinberg spreadsheet if you are unsure about how to make your own using Excel.
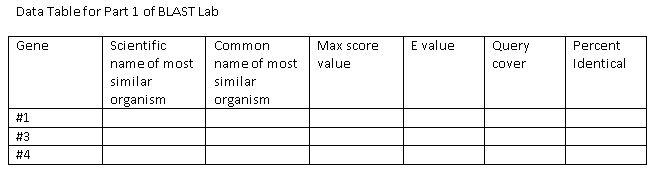
Lab 3: Comparing DNA with BLAST (Lab Report Due 9/17/13)
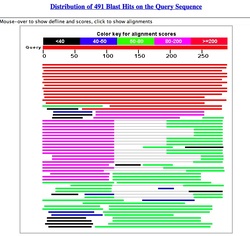
Use actual DNA sequences to create your own phylogenetic trees.
Download the pdf file of the lab here. Confused about the purpose of using DNA sequences to create phylogenetic trees? Try this really excellent tutorial.
Click here for the link to the gene files for the first part of the lab. You only need to download genes 1, 3, and 4 (if you have time, you may try gene 2--you might be surprised what it matches!).
Click here to go to the NCBI BLAST webpage. This is the page where you will upload your gene files.
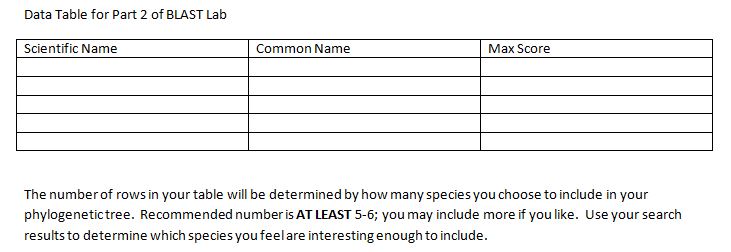
Part 2 of the BLAST Lab:
Entrez Gene website: http://www.ncbi.nlm.nih.gov/gene
Search for the gene of your choice using the suggestions in the lab manual or a gene of your own choosing. Instructions for conducting this search are given step-by-step in the lab manual, using the protein actin as an example!
BLAST homepage: http://blast.ncbi.nlm.nih.gov/Blast.cgi
Be sure to use the "nucleotide" (BLASTn) search to paste your FASTA sequence file from the Entrez Gene website. Again, instructions are given step-by-step in the lab manual!
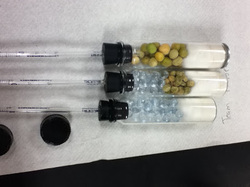
Lab 4: Diffusion and Osmosis (Mini-Poster Due 12/6/13)
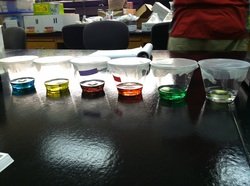
Explore the effect of solute concentration on the movement of water across a semipermeable membrane.
Download the pdf file of the lab here.
Download the pdf file of the lab here.
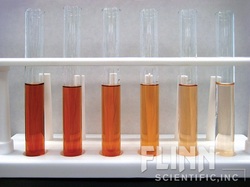
Class Data for Procedure 2 of Osmosis and Diffusion Lab:
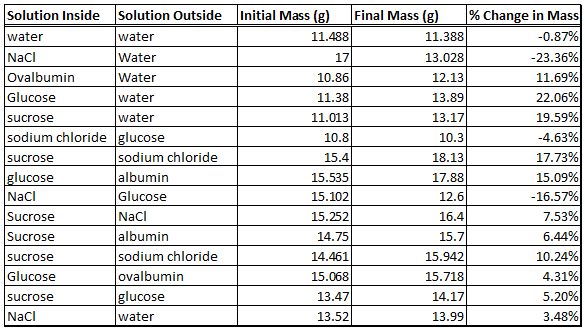
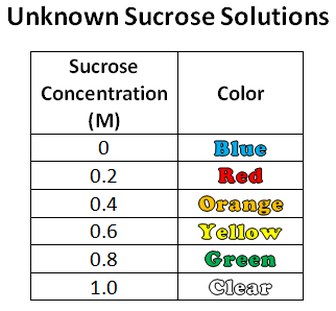
If you were unable to determine the correct concentrations of the sucrose solutions in lab, use the table to the left. You will need this information in order to analyze the data from your vegetable experiment.
Helpful tips on analyzing your data:
Helpful tips on analyzing your data:
- Your mini-poster NEEDS to have a graph of your vegetable experiment. You cannot accurately analyze your data without it.
- The sucrose solution concentrations are necessary to create this graph.
- Remember which variable (independent or dependent) goes on which axis (x or y). This will help you create the graph.
- A good graph includes a descriptive title, axis labels, and UNITS!
- Don't put a sloppy graph on your poster. Use a computer to generate a graph or draw it by hand NEATLY on GRAPH PAPER.
Molar Concentrations for the various vegetables as calculated by different lab groups:
Potato: 0.27 M
Celery: 0.2 M
Rutabaga: 0.65 M
Sweet Potato: 0.5 M
Zucchini: was not measured
Potato: 0.27 M
Celery: 0.2 M
Rutabaga: 0.65 M
Sweet Potato: 0.5 M
Zucchini: was not measured
Lab 5: Photosynthesis
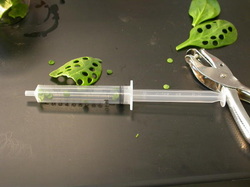
Investigate factors that affect the rate of photosynthesis in plant cells.
Download the pdf file of the lab here.
Download the pdf file of the lab here.
Lab 6: Cellular Respiration
Use a respirometer to measure the rate of cellular respiration in a living organism.
Download the pdf file of the lab here.
Download the pdf file of the lab here.
Lab 7: Mitosis and Meiosis
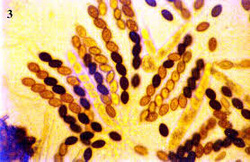
Investigate the effect of a fungal pathogen on mitosis in root cells, then observe crossing over in the fungus Sordaria fimicola.
Lab 8: Bacterial Transformation
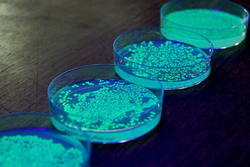
Use gene technology to create glow-in-the-dark bacteria!
Download the pdf file of the lab here. (We will be using the pGlo plasmid from BioRad and have a slightly different procedure, see below.)
Here is the Quick Guide Transformation Procedure from BioRad, and here is the entire Student Manual (with background information and analysis questions)
Download the pdf file of the lab here. (We will be using the pGlo plasmid from BioRad and have a slightly different procedure, see below.)
Here is the Quick Guide Transformation Procedure from BioRad, and here is the entire Student Manual (with background information and analysis questions)
Lab 9: Restriction Enzyme Analysis of DNA
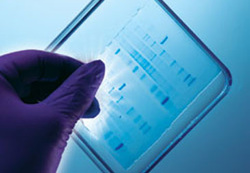
Use restriction enzymes to cut DNA into fragments, then separate them by size using gel electrophoresis.
Download the pdf file of the lab here.
Here is the original Carolina Genetic Screening Scenario and the PCR Background handout that you received in lab.
Here are the Lab Analysis Questions (including the semi-log paper for your standard curve).
Download the pdf file of the lab here.
Here is the original Carolina Genetic Screening Scenario and the PCR Background handout that you received in lab.
Here are the Lab Analysis Questions (including the semi-log paper for your standard curve).
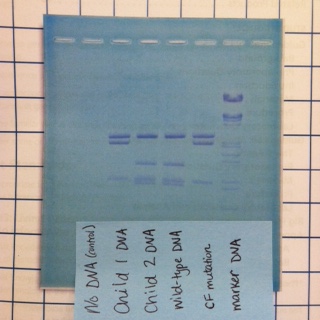
If you do not remember what the banding patterns looked like in the gel for this lab, you may refer to the image below:
Lab 10: Energy Dynamics
Investigate energy transfer between trophic levels by growing Wisconsin Fast Plants and butterfly larvae and measuring their change in mass over a period of several weeks.
Download the pdf file of the lab here.
Download the pdf file of the lab here.
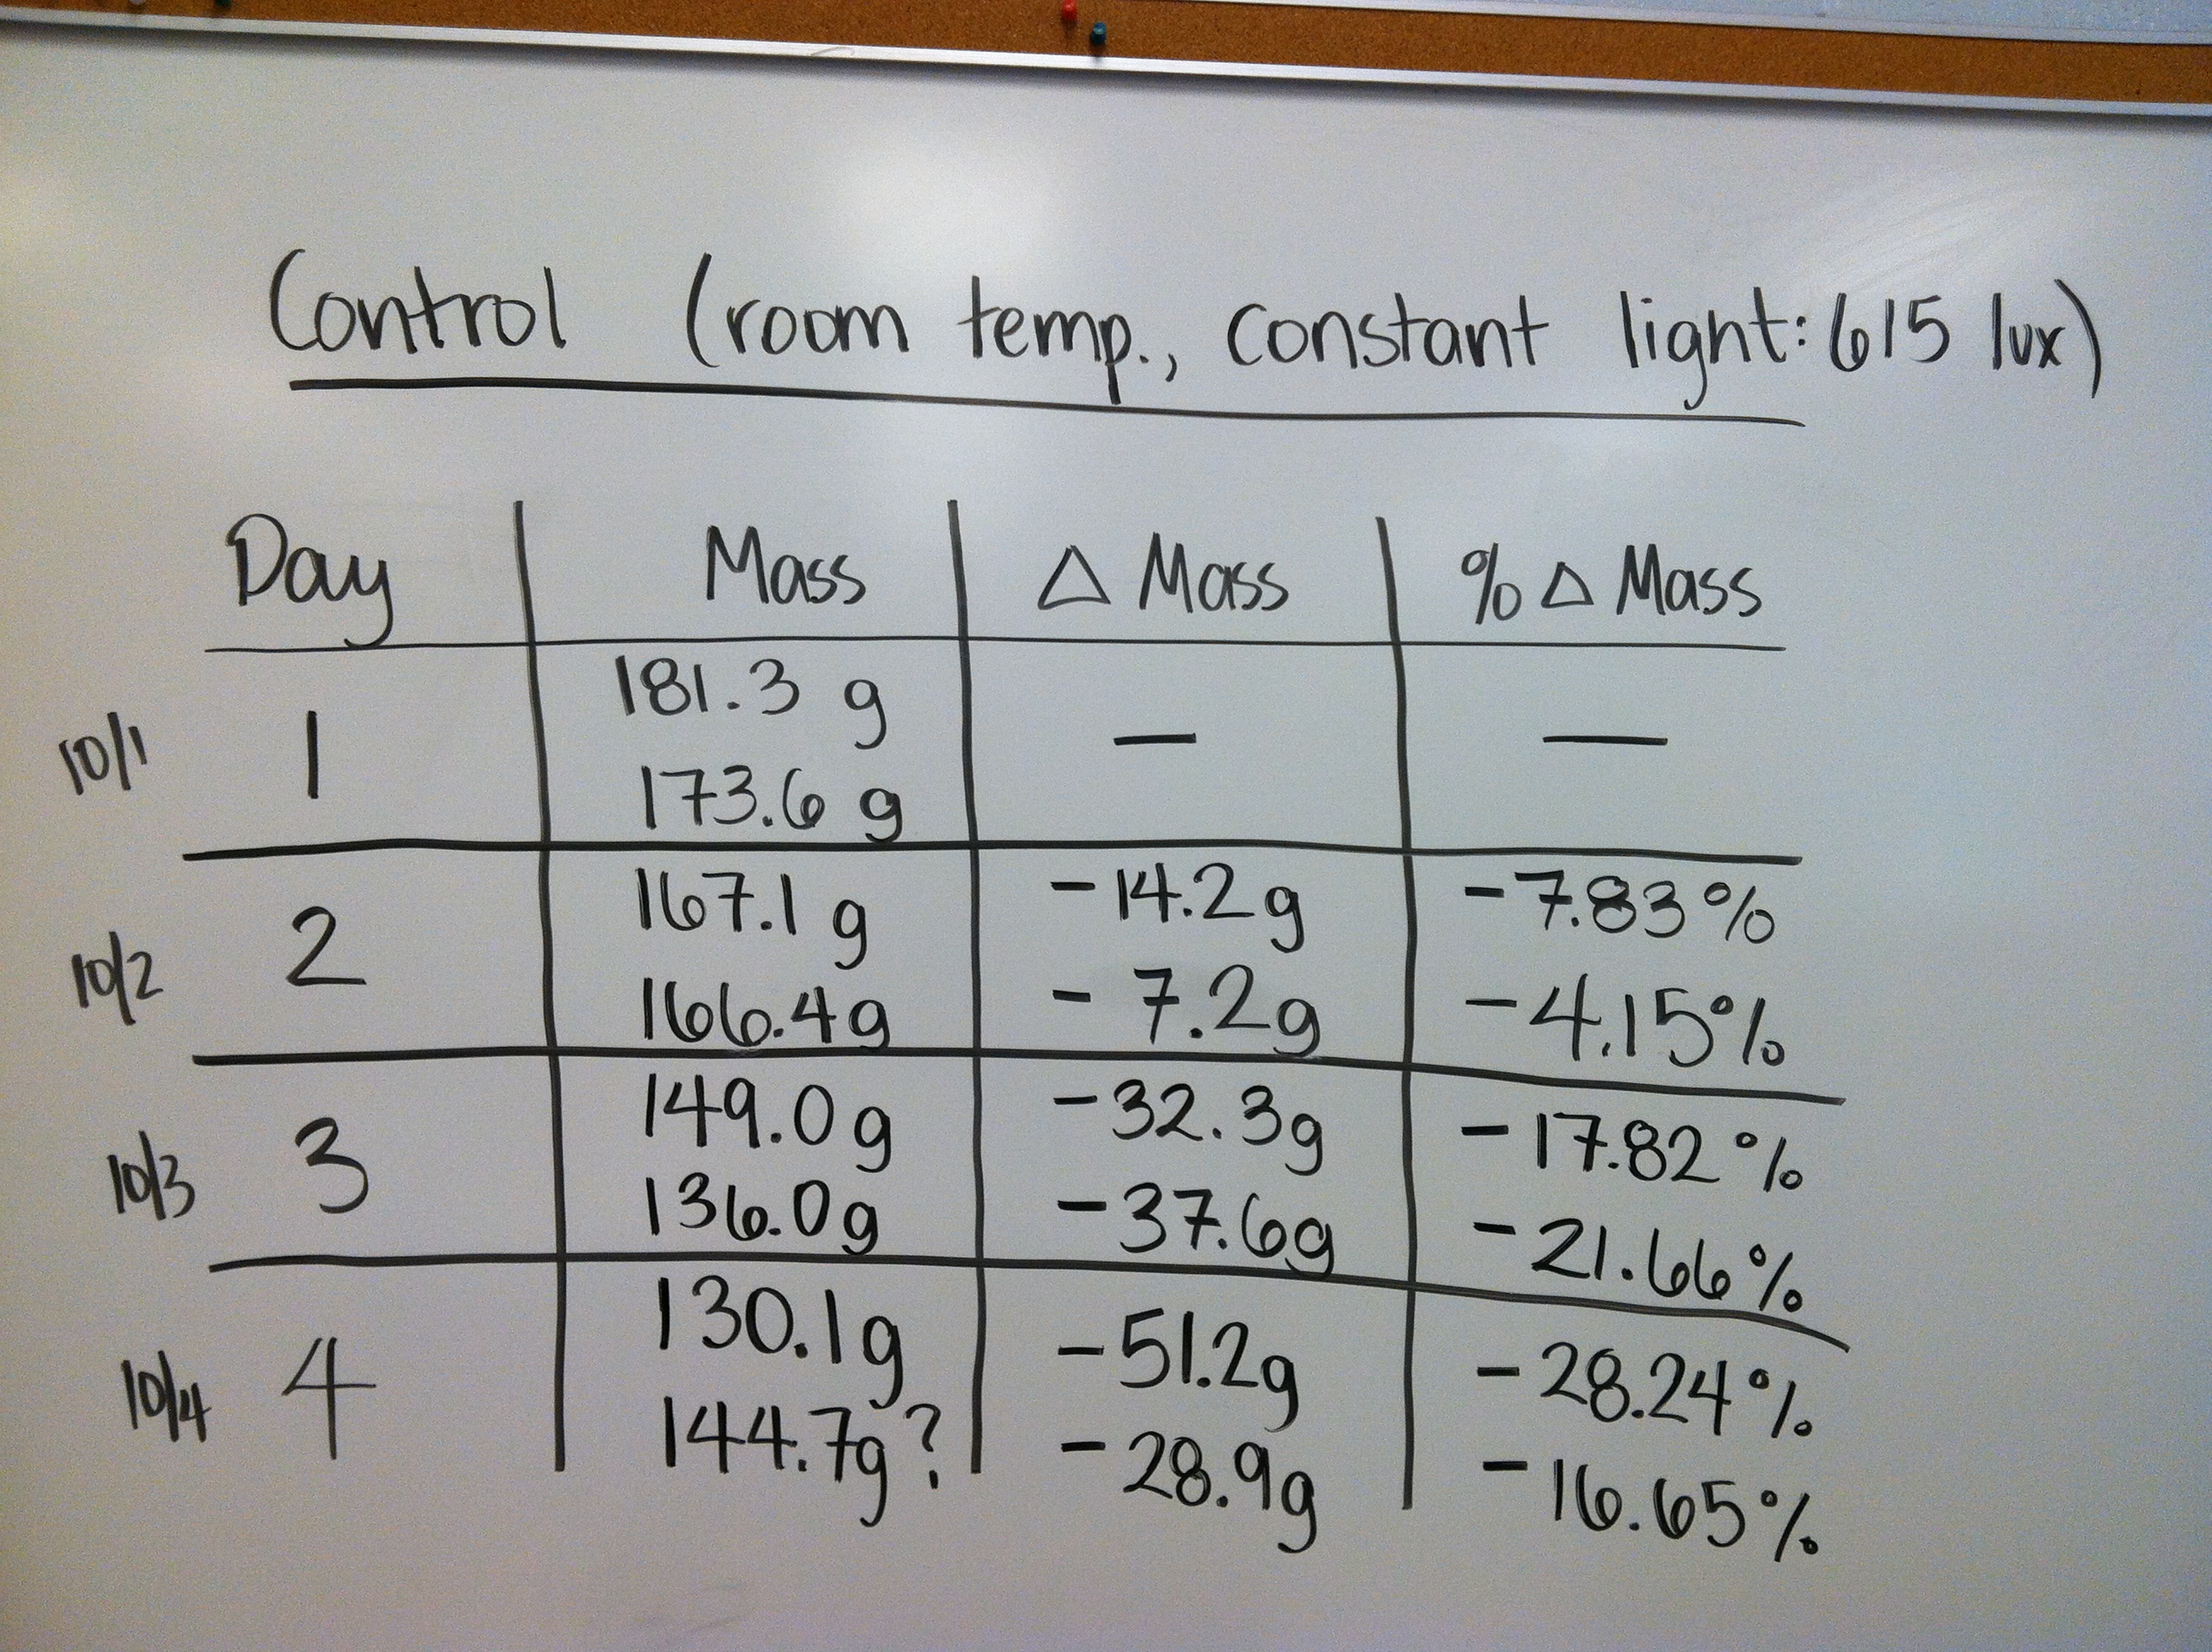
Lab 11: Transpiration (Mini-Poster Due 10/16/13)
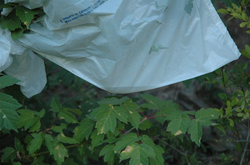
Determine how various environmental factors affect transpiration rate in plants.
Download the pdf file of the lab here.
See the class control plant data here.
Hints for your data section:
Download the pdf file of the lab here.
See the class control plant data here.
Hints for your data section:
- make a line graph (time series) of the % mass change over the four day period (if you report it as "% mass lost" then you can graph the absolute value of the % change instead of using the negative numbers)
- a rate is simply a change over time, therefore the slope of your line graph is the same thing as transpiration rate (Do you remember how to calculate slope???)
- average your replicates together before graphing your results
- don't forget to include the control in your graph
- you don't need to do the extra statistical test (t-test) from the lab manual
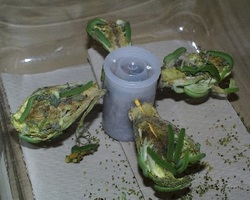
Lab 12: Animal Behavior
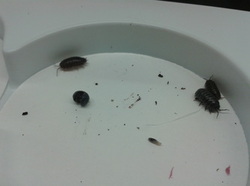
Test a variety of substances to see what attracts isopods (aka pill bugs).
Download the pdf file of the lab here. *Note that we will be modifying this procedure to use pill bugs in pre-made choice chambers instead of fruit flies in plastic bottles.*
Download the pdf file of the lab here. *Note that we will be modifying this procedure to use pill bugs in pre-made choice chambers instead of fruit flies in plastic bottles.*
Lab 13: Enzyme Activity
Conduct an experiment to test the rate of enzyme activity under a variety of conditions.
Download a pdf file of the lab here.
Download a pdf file of the lab here.
| Appendix B Constructing Line Graphs |
